

Public charging, quoted as an asset.
A fixed-scope quote for Level 2 through 500 kW DC fast charging, open to the public and owned by the property. Built on your site's electrical capacity, traffic profile and incentive stack — not a price per plug from a catalogue.
- Host-owned · open to the public
- Level 2 · DC fast to 500 kW · 1.2 MW Megacharger
- Load-managed & OCPP networked
- Metered for LCFS from day one
- Powered by the Revio national site-intelligence layer
Four of eight screens returned. The rest — stall count, modelled credit revenue, the incentive stack and the interconnection read — are produced by our underwriting team against this parcel and sent to you directly.
Figures are modelled estimates for screening, not a quotation or a guarantee of revenue. By submitting you agree to be contacted by phone or email by Revio, LLC and its partners regarding your project. See our Privacy Policy.
This is what comes back.
Not a brochure and not a phone call — the same underwriting screen our own team works from, run against your parcel.
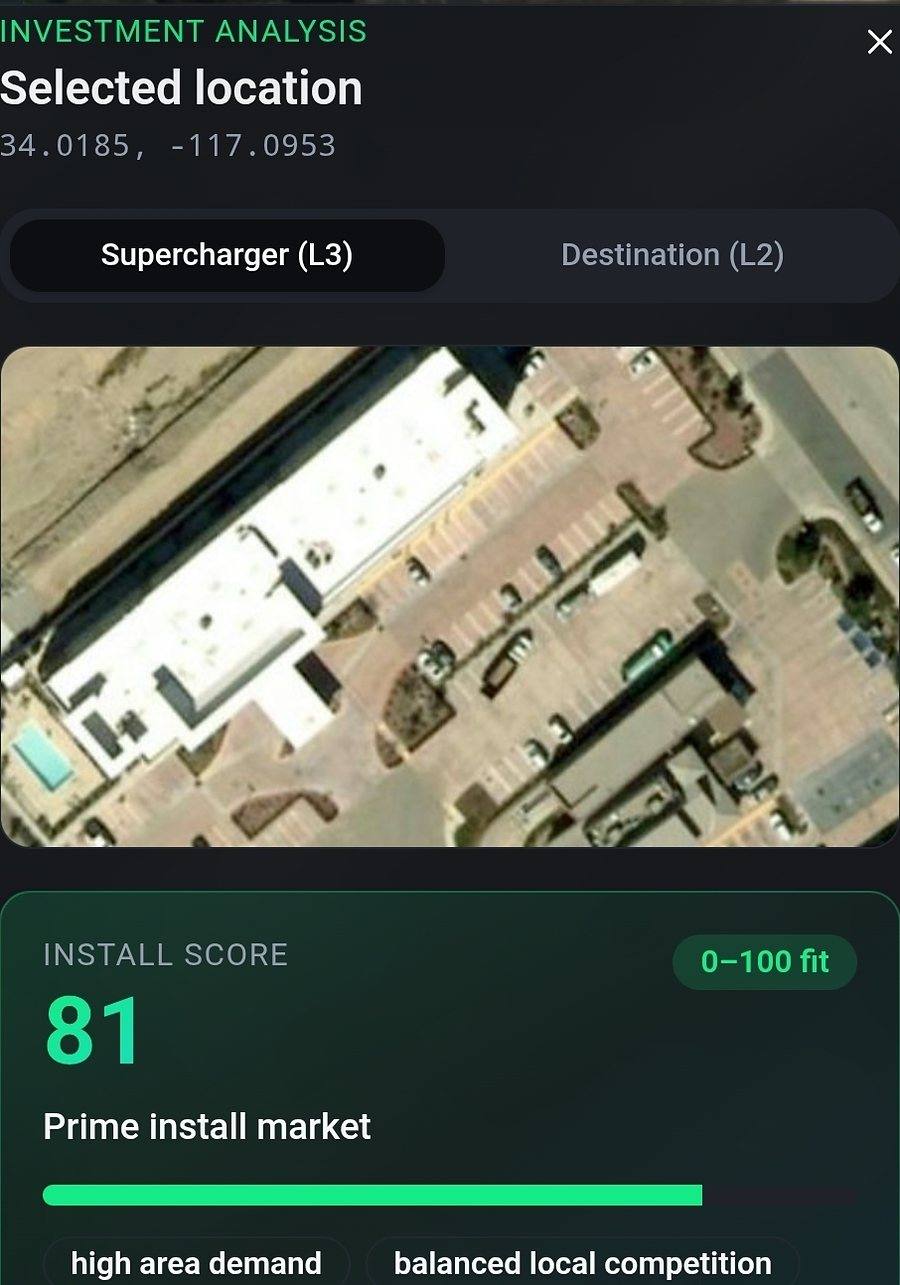
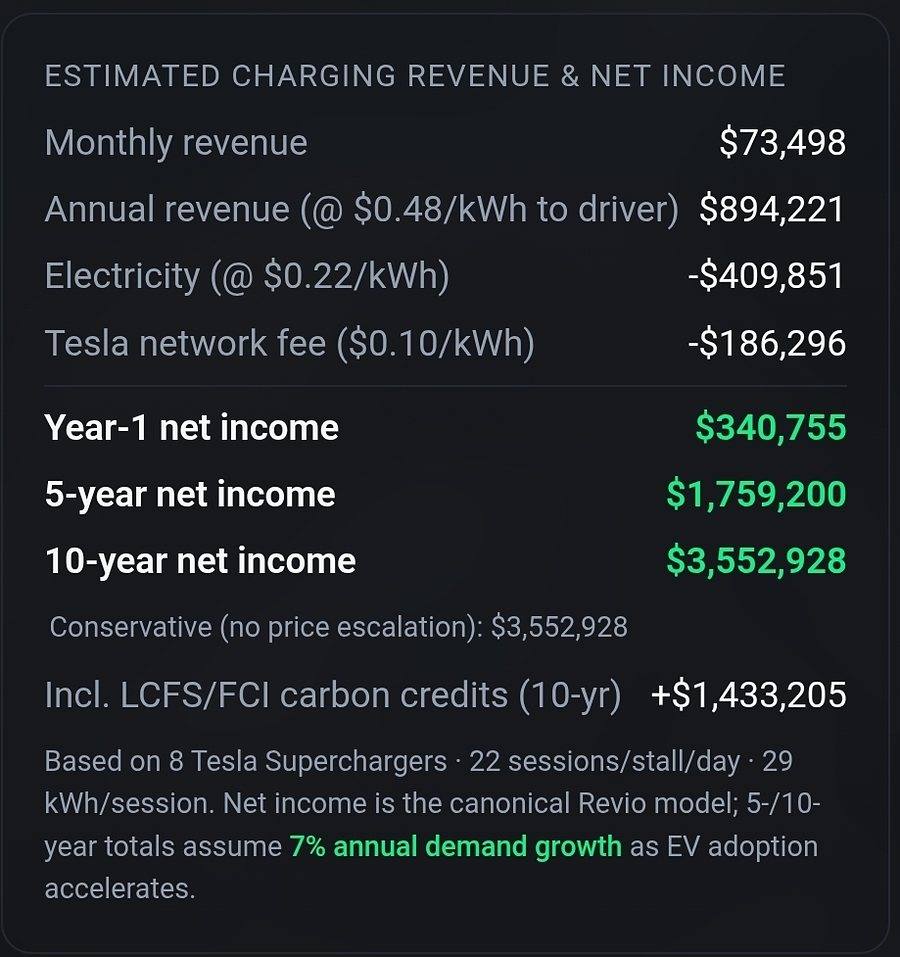
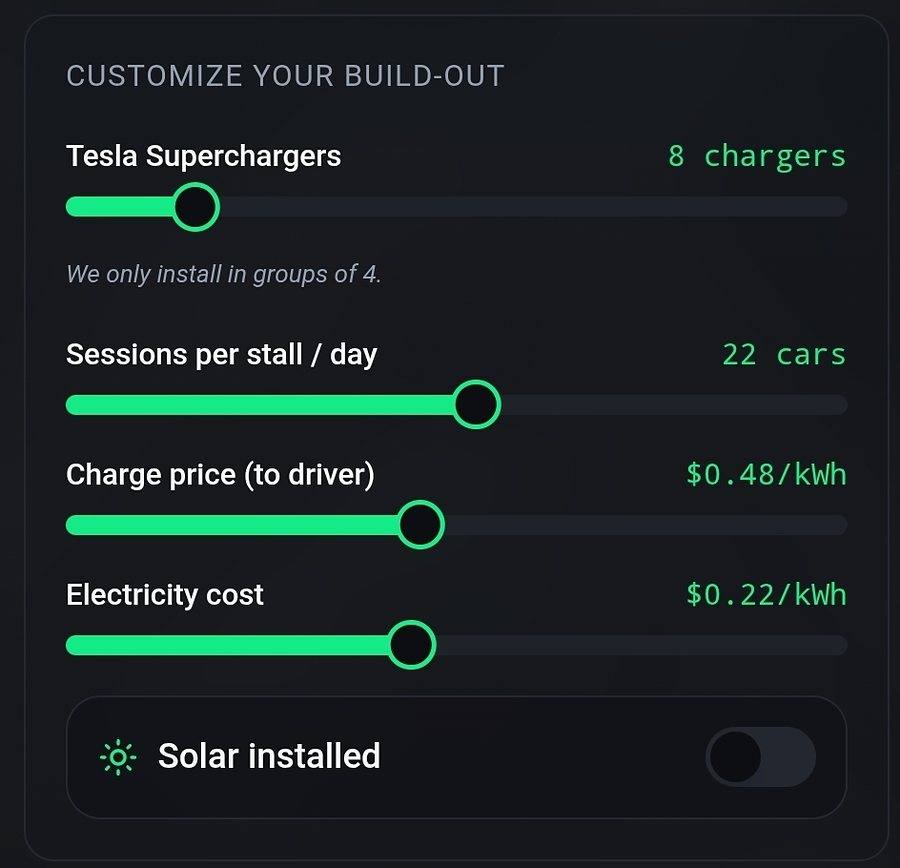
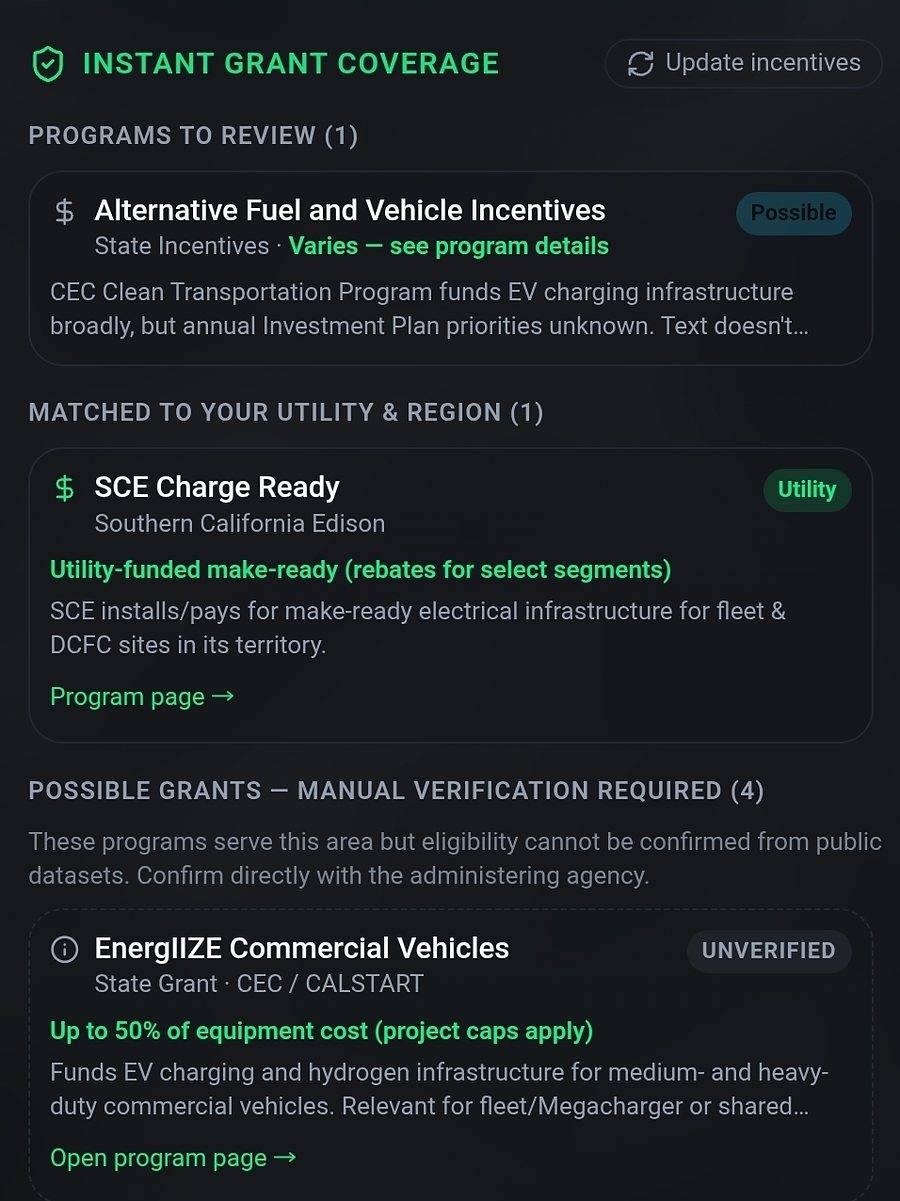
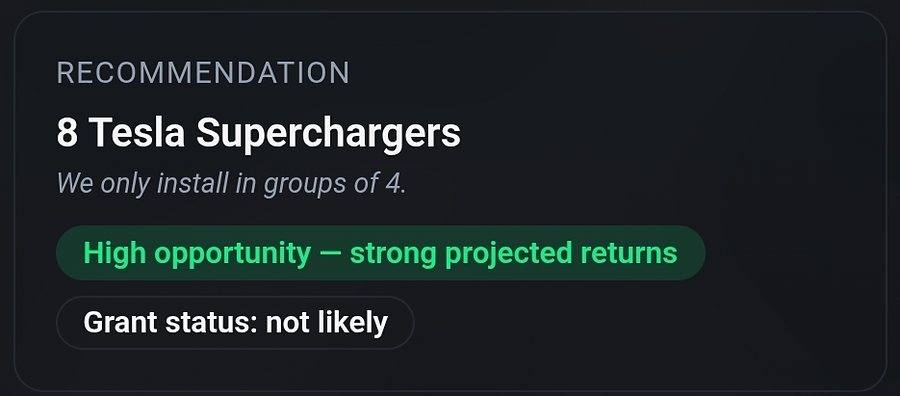
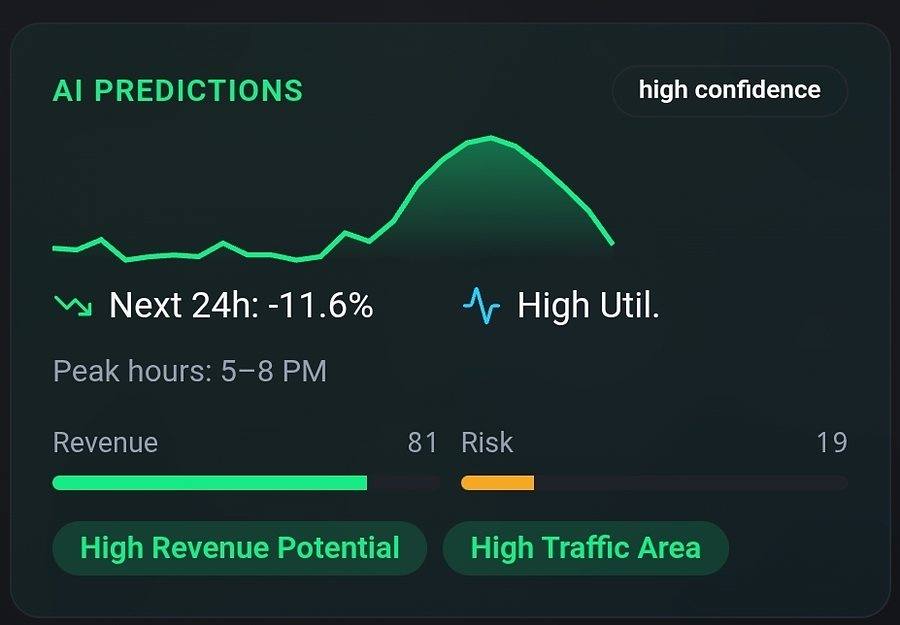
Screens from the Revio site-intelligence platform. Figures shown are modeled outputs for an example California parcel, not a quotation or a guarantee of revenue.
Five ways owning a public charger creates value.
You own the station and the public pays to use it. It is underwritten like any other income property — on the stack of revenue and offsets it produces, not the hardware alone.
Charging revenue
Per-kWh income from every public session, priced by you — compounding as EV adoption grows across your trade area.
LCFS credit revenue
Recurring carbon-credit income on every metered kilowatt-hour dispensed, paid quarterly. Qualifying DC fast sites add FCI capacity credits for up to ten years.
Grants & incentives
Federal, state, utility and air-district programs can offset a large share of installed cost — identified and filed by our in-house incentive team.
Customer dwell
Longer dwell time and repeat visits from high-value EV drivers — measurable in ticket size for retail, hospitality and grocery hosts.
Tax position
Owned equipment may qualify for accelerated depreciation. Coordinated with your tax counsel and sequenced to placed-in-service deadlines.
Modeled, not promised
Each stream enters your quote as a stated assumption you can audit — utilization, tariff, credit price, program window — never as a brochure figure.
Eligibility and results vary by site, utility and program window. Tax information is general in nature and is not tax, legal or accounting advice.
What strong California sites do.
Illustrative ranges from public program data and observed market performance — your quote models your site.
What we quote.
Workplace & destination
7.6–19.2 kW networked charging for retail, hospitality, offices and multifamily — public stalls, restricted stalls, or both.
- OCPP networked, access-controlled
- Load management on existing service
- Pricing & reporting per port
Public fast charging
Up to 500 kW, sited and engineered for utilization — and metered for credit revenue.
- Utility interconnection managed
- LCFS + FCI metering specified at design
- Uptime obligations engineered in
Tesla Semi & fleet
1.2 MW Megacharger stalls and 125 kW base chargers for Class 8 freight — staged to your capital plan.
- Charge scheduling against tariffs
- Conduit & capacity staged for growth
- Multi-site rollout, one coordinator
From address to fixed quote.
Site screen
Address, service capacity, parking layout and traffic profile — screened remotely against utility and program databases.
Model
Utilization, revenue, credit income and incentive stack modeled with every assumption stated.
Fixed quote
A scoped, fixed price with the incentive capture and net cost shown side by side. Yours to keep either way.
Tell us about the site.
We return a modeled quote — utilization, revenue, incentives and net cost — within a few business days. No site visit needed for the first pass.
A principal will follow up with your modeled quote within a few business days.
Questions owners actually ask.
Who owns the chargers under Revio's model?
The property owner does. Unlike a host agreement — where a network leases your stalls, owns the equipment and pays you rent — Revio develops the site as your asset. The charging revenue, the LCFS credits, the depreciation and the equipment itself stay with the property. Operations can be contracted out without giving up ownership.
What is the difference between Level 2, DC fast charging and a Megacharger?
Level 2 (7.6–19.2 kW) suits places where cars park for hours — hotels, offices, retail. DC fast charging (roughly 150 kW up to 500 kW) serves drivers who stop for minutes, open to the public. Megacharger-class equipment (up to 1.2 MW) charges Class 8 electric trucks like the Tesla Semi during mandated rest breaks.
Do drivers need a Tesla to use the chargers?
No. Sites are configured as public charging open to any driver who pulls in. With the industry converging on the NACS connector and adapters bridging CCS vehicles, a well-specified site serves effectively the whole passenger EV fleet.
How long does a charging project take?
The schedule is usually set by the utility, not construction. Service upgrades and interconnection studies commonly run months and depend on the utility's queue and transformer availability, which is why we file the utility application at the start of the project and run permitting, incentive filings and design in parallel.
What does a DC fast charging site cost to build?
It is genuinely site-specific — driven by the electrical service required, the distance from the utility point of connection, stall count and equipment class. Make-ready programs, grants and credit pathways can offset a substantial share when the applications are engineered into the project from day one. That is what the fixed-scope quote resolves for your parcel.
Who handles maintenance and uptime after the site is live?
Operations are contractible: monitoring, maintenance, pricing management and driver support run under service agreements with uptime commitments — while the asset stays yours. A public site's reliability is its reputation, so those commitments belong in writing.