

The 80% rule and session design
A DC fast stall does not deliver a constant rate of power for the length of a session. It delivers most of its energy fast, then spends a disproportionate share of the remaining time delivering the rest slowly, because the battery on the other end of the cable is protecting itself. Hosts who price and staff a site as if every minute plugged in were worth the same minute are underwriting the wrong curve.
Why the curve bends
A lithium-ion pack accepts charge fastest when it is emptiest and slowest as it fills, because the battery management system tapers current to protect cell health and manage heat as the cells approach full. The taper is not a network limitation or a hardware fault, it is chemistry, and it shows up on effectively every EV on the road today in the same rough shape: a steep climb from a low state of charge, a gentler climb through the middle of the range, and a long, shallow tail from roughly 80% state of charge to 100%. The exact inflection point and the shape of the tail vary by pack chemistry, temperature and vehicle, but the direction never reverses. Charging always gets slower as the battery gets fuller.
The practical consequence is that the last fifth of a battery's capacity can take a meaningful share of total session time to deliver, even though it represents a small share of the energy sold. A stall spending that time on a nearly-full car is a stall not available to the next driver, and a site that has not designed around the taper is trading throughput it cannot see for a top-off no driver strictly needed.
A stall's real product is turns, not kilowatt-hours
Revenue per stall is a function of sessions per day multiplied by average revenue per session, and sessions per day is capped by how long each car occupies the plug. Two sites that sell an identical number of kilowatt-hours in a day can have very different economics if one turns its stalls twice as often, because the site with more turns is spreading its fixed costs, demand charge, land, equipment, across more transactions and is exposed to fewer queue-driven walkaways during a busy hour. The taper is precisely where that difference gets made or lost, because it is the part of the session where the cost of occupancy keeps running while the revenue from that specific car slows to a trickle.
Designing the session around the curve
None of this argues for cutting drivers off, it argues for pricing and site rules that make the true cost of a long tail visible to the person occupying the stall. The tools available to a host are the same handful used at any throughput-sensitive facility:
- Idle or overstay fees that begin once a session's charge rate has clearly fallen off, so a car finishing its taper past a reasonable point is paying for the stall it is holding rather than the energy it is receiving.
- Session or time caps at sites with real queue pressure, set high enough to complete a normal charging need and low enough to discourage a routine full-to-100% top-off during a peak hour.
- Stall-count sizing that treats average session length, taper included, as the real occupancy input, not the manufacturer's peak charge rate, which describes the first minutes of a session and nothing about the last ones.
- Signage and app messaging that tells a driver plainly when a car has reached the point of diminishing returns, which does more to change behavior voluntarily than a fee schedule most drivers never read.
Each of these is a modest operational decision on its own. Together they are the difference between a site whose stall count was sized off a spec sheet and a site whose stall count was sized off how cars actually charge.
Why this belongs in underwriting, not just operations
Session design is easy to treat as a day-two problem, something to tune after a site opens and the first month of data comes in. That is a mistake, because the taper changes the stall count a site needs to hit a given throughput target, and stall count is a capital decision made at design time, not a dial turned after construction. A pro forma built on a flat, best-case charge rate will overstate sessions per day at exactly the sites busy enough for the difference to matter, and will understate the stall count needed to hit the utilization the pro forma promised. Building the taper into the underwriting from the first model is what keeps the finished site's real throughput from disappointing the plan that financed it.
The sites that get this right are not the ones with the fastest chargers on paper. They are the ones whose pricing, signage and stall count were built around how a session actually behaves for the last fifth of its charge, which is the part every operator sees and few design for.
Model throughput before you build
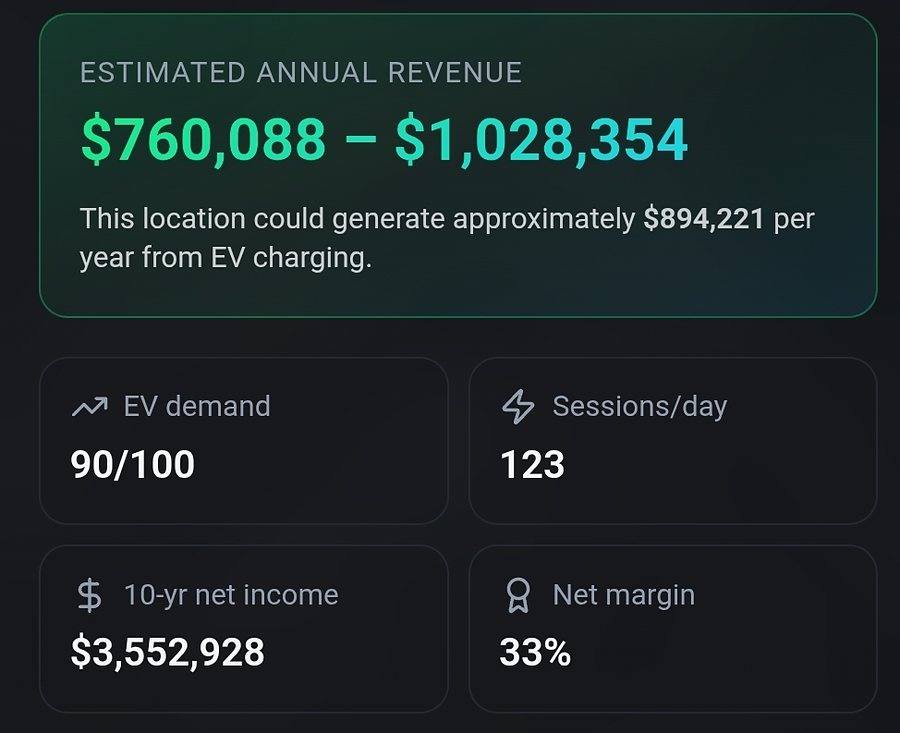
Enter an address and our site-intelligence layer returns the preliminary screen, parcel, utility territory and sessions-per-day estimate, sized to how charging sessions actually run, as a starting point for the underwriting.
Run a Site Scan