

Utilization curves and the year-two inflection
A fast-charging site does not open at its steady-state utilization and stay there. It opens quiet, because a new stall has no history yet, no reviews, no place in a routing app's memory and no habitual drivers who already treat it as theirs. Utilization climbs from there on a curve, and for most host-owned sites the curve has a visible knee somewhere around the second year. Hosts who read the first twelve months as the verdict on the asset are reading the flattest part of the line.
Why the first year undersells the site
A brand-new stall is invisible in ways that have nothing to do with its speed or its price. In-car navigation and third-party routing apps index charging locations on a lag, so a site can be live and metering energy for weeks before it consistently shows up as an option along a route. Reviews and reliability ratings, the signals a driver actually weighs when two stalls are both within range, do not exist yet, and a site with no rating reads as a risk to a driver deciding where to stop. Repeat usage, the highest-margin kind because it costs nothing to acquire, cannot exist before a first visit does.
None of this is a defect in the site. It is the ordinary lag between an asset becoming operational and an asset becoming known, and it applies whether the parcel sits on a strong corridor or a weak one. A site sees a distorted picture of its own long-run demand for as long as this lag has not cleared, and a host measuring performance against a pro forma written for the steady state will see a gap that looks like underperformance and is actually just timing.
What actually moves between year one and year two
The inflection is not one event, it is several slow-moving inputs clearing at roughly the same time. The local EV population served by the site keeps growing through the site's first year, so the addressable driver base at month twelve is simply larger than it was at month one, independent of anything the host did. Routing apps and OEM navigation systems catch up to a site's existence and begin surfacing it as a normal option rather than a recent addition. A site that has run cleanly for a year accumulates a reliability record and driver reviews, which start to do the work of converting a hesitant first-time visitor into a returning one. And a meaningful share of repeat sessions are habitual, drivers who charge on the same day of the week at the same stop as part of a routine, a behavior that by definition cannot show up until a driver has visited enough times to form it.
None of these inputs is dramatic on its own. Together, arriving in roughly the same window, they are what produces a curve that looks flat for several quarters and then bends upward without any change to the equipment, the pricing or the site itself.
Underwriting the ramp instead of the snapshot
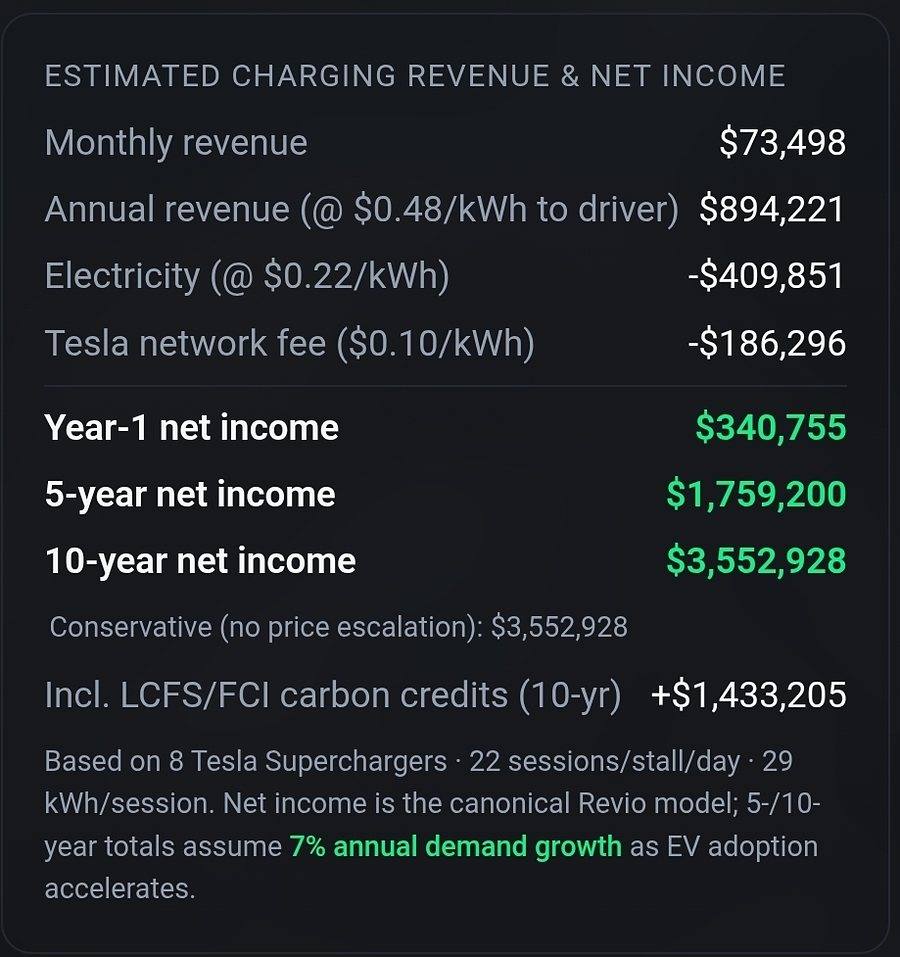
The practical failure mode is treating year one as if it were representative and extrapolating a flat line from it, in either direction. A pro forma built on a single steady-state utilization number, applied from month one, will show a site missing its target for most of its first year even when the asset is on track, and a host reading that gap without a ramp assumption underneath it can make decisions the actual trajectory does not support: discounting the site in a resale conversation, second-guessing a stall count that was sized for year three, or judging an operator by a metric that has not finished forming.
The fix is not optimism, it is modelling the shape of the curve rather than a point on it: a lower utilization assumption in the first several quarters, a visible step up as the inputs above clear, and a steady state that the pro forma treats as a destination rather than a starting line. Financing and reserves sized against the ramp, not against the eventual steady state, are what let a site survive its own slowest quarters instead of being judged, or sold, before the curve has had the time it needs to bend.
A site's first-year numbers are real, and they belong in the model. What they are not is the site's answer. That comes later, once the region has had enough time to learn where the stalls are.
Model the ramp before you underwrite the steady state
Enter an address and our site-intelligence layer returns the preliminary screen, parcel, utility territory and demand signals, a starting point for modelling how a site's utilization is likely to build over its first several years.
Run a Site Scan